Starting with a small pilot in Spring 2021, Trinity College transitioned to Watermark Course Evaluations and Surveys (CES) to administer course evaluations. For all courses evaluated through DukeHub from Summer II 2013 to Spring 2021, course evaluation results remain available in Tableau. The instructions for reviewing course evaluation reports in Tableau are included below. For all course evaluations administered through Watermark Course Evaluations and Surveys (CES) the results are housed in CES, please refer to these instructions.
Updated October 2021
You may prefer to access:
- The comprehensive Users' Guide for course evaluation reports in Tableau
- A code sheet (the labels for the numeric ratings on the questionnaire)
Log-in
If you will be a regular user of course evaluation reports, consider bookmarking tableau.oit.duke.edu. This is your point of access to the course evaluation reports starting with all semesters from Summer II 2013 - present.
Access to Tableau server requires completion of multi-factor authentication (MFA) when signing in. For more information about multi-factor authentication, see the OIT resource on Multifactor Authentication. If prompted during login you will need to select Tableau Production from the available sites (Student, Tableau Production, and Duke Community). If you have questions about logging into Tableau or need assistance with MFA, please contact the OIT Help Desk at 919-684-2200.

Faculty will be authorized to view evaluation results for the courses in which they taught, as well as relevant comparison reports for the department, for all divisions, and for Trinity College overall.
Department-level users (e.g., Directors of Undergraduate Studies, authorized staff assistants) are pre-assigned membership in a group for their department or program. If you need to request a change to the group of individuals authorized to view department-level reports, please continue to submit such requests here: http://bit.ly/CE_access.
Navigating Tableau reports
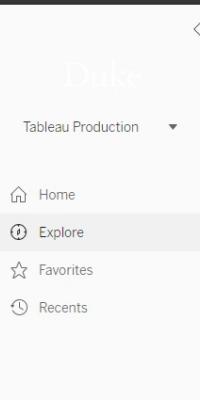
Upon successful log-in, you will see a menu of the workbooks to which you have been given access. If you log into the site using tableau.oit.duke.edu, you will find yourself on the “Home” screen, which looks like this:

Course reports are located under the “Explore” window, which can be accessed by the grey toolbar on the left side. The explore icon is the one that is a compass.
Once on the Explore pane, click on the AAS folder. From there, locate the term for which you want to view course evaluations.
If the user interface looks confusing, or you cannot find course evaluations immediately, try one of two things:
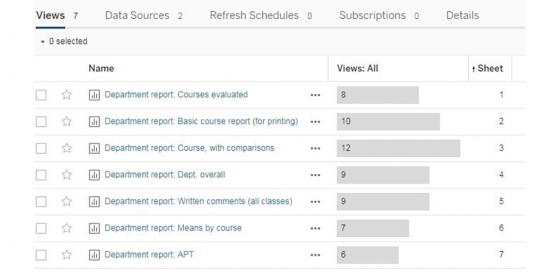
- Click on Toggle View Mode in the upper right once youv'e accessed the AAS folder. If, upon log-in, your default view was "Grid", Tableau will show you thumbnails of each available report. Toggling to List View will make navigating the reports a bit clearer - especially for individuals with access to many different reports.
- There's a Filter/Search bar in the top header. Search for "Course evaluation", and course evaluation reports from summer II 2013 forward will be retrieved.
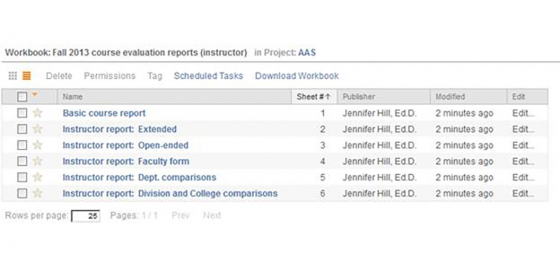
Upon successful log-in, you will see a menu of the workbooks to which you have been given access. For example, the title of the workbook for Summer II 2017 course evaluations is titled Summer II 2017 Course Evaluations. Click on the Tableau icon or the Workbooks link in the upper left at any time to return to this menu.
What faculty see:

What departmental personnel see:
Make sure you’re in the course evaluations workbook for your preferred term, then click on any of the reports. Right away, notice that there’s a menu of reports along the top of the screen. You can choose which report (aka dashboard) you wish to use, either from this menu or by returning to the main Tableau homepage.
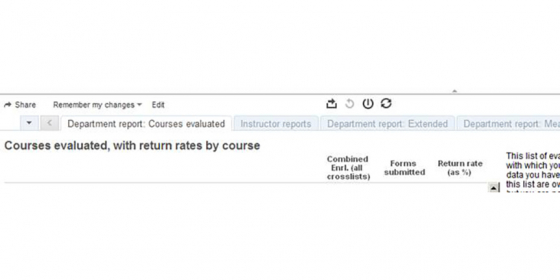
Note that you no longer have access to separate documents for individual courses or departments. There is only one report interface, containing all of the results to which you have access. Tableau allows you to filter or separate the results, such as by course.
Understanding the content of the reports
In general, the reports give you means and frequencies across all of the questions on the student form. Moreover, you have the following capabilities in Tableau:
- You can select or deselect any group or groups of questions. The standard question groups pertain to quality of the course, course dynamics, quality of instruction, and the Trinity College learning objectives.
- You can select or deselect a course or courses from this view.
- You can select or deselect particular groups of students by class standing. In the future, it may be possible to make available additional student-level parameters (e.g., major) by which you can sort the data.

Using, printing, exporting from Tableau
Tableau gives you more options for using and exporting the contents of your reports. Look for a small rectangular icon sitting above the reports labeled Download. When clicked, this icon opens a menu of four different print options: Image, Data, Crosstabs, and PDF. Depending on the view, some of the options may be deactivated.

The table below summarizes each of these print/export options, and our recommendations for using these options most effectively. CAUTION: For all of these options, please be aware that Tableau will print or export the content of the tables or figures as you have defined them.
|
PDF: This Dashboard |
PDF: Sheets in Dashboard |
PDF: Sheets in Workbook |
Cross-tabs |
Image |
Data |
|
|
Description |
Provides a PDF of exactly and only the contents of the screen. If you’ve selected multiple question categories, such that your tables and figure require scroll bars, the PDF will truncate some of the content. |
Provides a multi-page PDF of the full tables that feed the screen you’re looking at. Some of the lengthy text may be cut-off, but all of the cells in the table will be present. |
Provides a multi-page PDF of all of the worksheets that go into the course evaluation process generally, many of which will be void of data in your view due to lack of user privileges. |
Exports the contents of a single table to Excel. Includes all values in the table, including all text. |
Provides a quick screen capture. |
Provides the overall/average results for all respondents, subject to the filters you selected. “Underlying” view, however, is the extracted raw data that populate the report. You have access only to the narrow subset data that feed that report, and not the comprehensive evaluation raw data file. |
|
When to use? |
When you want a screen capture of exactly what you see on your monitor. |
When you want to print or export the full, unconstrained content of a report. Best to use when your report has scroll bars, and you need your print-out to include information you have to scroll to view. |
Rarely recommended. This option produces a report many pages longer than you need, and the extensive content may make interpretation and summary difficult. |
When you wish to work with evaluation results in Excel. When you need all text to be visible, unconstrained by cell boundaries. |
To add an excerpt from a report to an email or to paste into another document (e.g., MS Word). |
Rarely recommended. The format of the extracted data are of limited analytical use. |
|
How to use? |
Click on the Export icon, select PDF. Choose Landscape, then Content: This Dashboard. Click Export. |
Click on the Export icon, select PDF. Choose Portrait, then Content: Sheets in Dashboard. Click Export. It may take a few minutes. |
Click on the Export icon, select PDF. Choose Portrait, then Content: Sheets in Workbooks. Click Export. It may take a few minutes. |
You must click within the table you wish to export. A thin gray border will appear around the table. Click on the Export icon, select Crosstabs. (If you have not clicked inside the selected table, the Crosstabs option will be inactive.) You will be prompted to Download the crosstabs, then Open in Excel. Or you may save it to a file location of your choice. |
Click on the Export icon, select Image. You will be prompted to Download the image, then open it in your preferred viewer or save it to a file location of your choice. |
You must click within the table whose data you wish to export. A thin gray border will appear around the table. Click on the Export icon, select Data. |
Need help?
If you have technical problems accessing the course evaluation questionnaires (student or faculty) in DukeHub, please contact the OIT Help Desk at 919-684-2200. Note that evaluation forms typically are available only for two weeks prior to the last day of class. Exceptions exist for select graduate-level classes and study abroad classes.
If you have general questions about the development or use of course evaluations reports in Tableau, please contact the Office of Assessment, Trinity College, at assessment@duke.edu or 919-668-1617. Questions about the use of evaluation results for APT should be directed to the Provost's Office for Faculty Affairs (http://www.facultyaffairs.provost.duke.edu/index.html).
If you have technical questions about the use of Tableau, please contact the Office of Assessment, Trinity College, at assessment@duke.edu or 919-668-1617.
You may prefer to access:
- The comprehensive Users' Guide for course evaluation reports in Tableau
- A code sheet (the labels for the numeric ratings on the questionnaire)
Log-in
If you will be a regular user of course evaluation reports, consider bookmarking tableau.oit.duke.edu. This is your point of access to the course evaluation reports starting with the Summer II 2013 process.
You will log-on with your netID and passcode.
Access to Tableau server requires completion of multi-factor authentication (MFA) when signing in. For more information about multi-factor authentication, see the OIT resource on Multifactor Authentication. If prompted during login you will need to select Tableau Production from the available sites (Student, Tableau Production, and Duke Community). If you have questions about logging into Tableau or need assistance with MFA, please contact the OIT Help Desk at 919-684-2200.
Faculty will be authorized to view evaluation results for the courses in which they taught, as well as relevant comparison reports for the department, for all divisions, and for Trinity College overall.
Department-level users (e.g., Directors of Undergraduate Studies, authorized staff assistants) are pre-assigned membership in a group for their department or program. If you need to request a change to the group of individuals authorized to view department-level reports, please continue to submit such requests here: http://bit.ly/CE_access.
Navigating Tableau reports
Upon successful log-in, you will see a menu of the workbooks to which you have been given access. If the user interface looks confusing, or you cannot find course evaluations immediately, try one of two things:
- Click on Workbooks in the upper left. If, upon log-in, your default view was "Views", Tableau was showing you every component of every report to which you have access. Clicking on Workbooks, will present the reports to which you have access in a more organized way.
- There's a Filter/Search bar at left. Search for "Course evaluation", and course evaluation reports from summer II 2013 forward will be retrieved.
Upon successful log-in, you will see a menu of the workbooks to which you have been given access. For example, the title of the workbook for Summer II 2013 course evaluations is titled Summer II 2013 Course Evaluations. Click on the Tableau icon or the Workbooks link in the upper left at any time to return to this menu.
What faculty see:
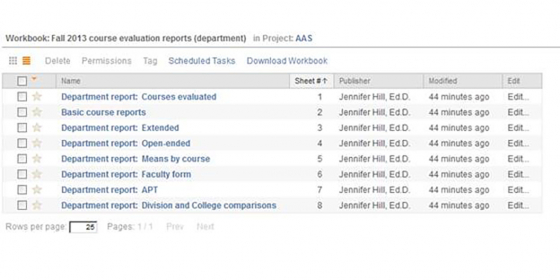
What departmental personnel see:
Make sure you’re in the course evaluations workbook for your preferred term, then click on any of the reports. Right away, notice that there’s a menu of reports along the top of the screen. You can choose which report (aka dashboard) you wish to use, either from this menu or by returning to the main Tableau homepage.

Note that you no longer have access to separate documents for individual courses or departments. There is only one report interface, containing all of the results to which you have access. Tableau allows you to filter or separate the results, such as by course.
Understanding the content of the reports
In general, the reports give you most of the information you used to obtain from the PDF reports: means and frequencies across all of the questions on the student form. In fact, as of spring 2014, you can print a one-page PDF of a single course report, as faculty and staff were able to do in the past.
Moreover, you have the following new capabilities in Tableau:
- You can select or deselect any group or groups of questions. The standard four question groups pertain to quality of the course, course dynamics, quality of instruction (instructor 1), and the Trinity College learning objectives. Additional question groups available for use pertain to the Modes of Inquiry (plus Quantitative Studies) that may pertain to the course under review.
- You can select or deselect a course or courses from this view. This is especially helpful if you wish to aggregate the results across several or all of your classes.
- You can select or deselect particular groups of students by class standing. In the future, it may be possible to make available additional student-level parameters (e.g., major) by which you can sort the data.

Using, printing, exporting from Tableau
Tableau gives you more options for using and exporting the contents of your reports. Look for a small rectangular icon sitting above the reports. When clicked, this icon opens a menu of four different print options: Image, Data, Crosstabs, and PDF. Depending on the view, some of the options may be deactivated.

The table below summarizes each of these print/export options, and our recommendations for using these options most effectively. CAUTION: For all of these options, please be aware that Tableau will print or export the content of the tables or figures as you have defined them.
| PDF: This Dashboard | PDF: Sheets in Dashboard | PDF: Sheets in Workbook | Cross-tabs | Image | Data | |
| Description | Provides a PDF of exactly and only the contents of the screen. If you’ve selected multiple question categories, such that your tables and figure require scroll bars, the PDF will truncate some of the content. | Provides a multi-page PDF of the full tables that feed the screen you’re looking at. Some of the lengthy text may be cut-off, but all of the cells in the table will be present. | Provides a multi-page PDF of all of the worksheets that go into the course evaluation process generally, many of which will be void of data in your view due to lack of user privileges. | Exports the contents of a single table to Excel. Includes all values in the table, including all text. | Provides a quick screen capture. | Provides the overall/average results for all respondents, subject to the filters you selected. “Underlying” view, however, is the extracted raw data that populate the report. You have access only to the narrow subset data that feed that report, and not the comprehensive evaluation raw data file. |
| When to use? | When you want a screen capture of exactly what you see on your monitor. | When you want to print or export the full, unconstrained content of a report. Best to use when your report has scroll bars, and you need your print-out to include information you have to scroll to view. | Rarely recommended. This option produces a report many pages longer than you need, and the extensive content may make interpretation and summary difficult. | When you wish to work with evaluation results in Excel. When you need all text to be visible, unconstrained by cell boundaries. | To add an excerpt from a report to an email or to paste into another document (e.g., MS Word). | Rarely recommended. The format of the extracted data are of limited analytical use. |
| How to use? |
Click on the Export icon, select PDF. Choose Landscape, then Content: This Dashboard. Click Export. |
Click on the Export icon, select PDF. Choose Portrait, then Content: Sheets in Dashboard. Click Export. It may take a few minutes. |
Click on the Export icon, select PDF. Choose Portrait, then Content: Sheets in Workbooks. Click Export. It may take a few minutes. |
You must click within the table you wish to export. A thin gray border will appear around the table. Click on the Export icon, select Crosstabs. (If you have not clicked inside the selected table, the Crosstabs option will be inactive.) You will be prompted to Download the crosstabs, then Open in Excel. Or you may save it to a file location of your choice. |
Click on the Export icon, select Image. You will be prompted to Download the image, then open it in your preferred viewer or save it to a file location of your choice. |
You must click within the table whose data you wish to export. A thin gray border will appear around the table. Click on the Export icon, select Data. |
Need help?
If you have technical problems accessing the course evaluation questionnaires (student or faculty) in SISS/ACES/STORM, please contact the OIT Help Desk at 919-684-2200. Note that evaluation forms typically are available only for two weeks prior to the last day of class. Exceptions exist for select graduate-level classes and study abroad classes.
If you have general questions about the development or use of course evaluations, please contact the Office of Assessment, Trinity College, at assessment@duke.edu or 919-668-1617. Questions about the use of evaluation results for APT should be directed to the Provost's Office for Faculty Affairs (http://www.facultyaffairs.provost.duke.edu/index.html).
If you have technical questions about the use of Tableau, please contact the Office of Assessment, Trinity College, at assessment@duke.edu or 919-668-1617.